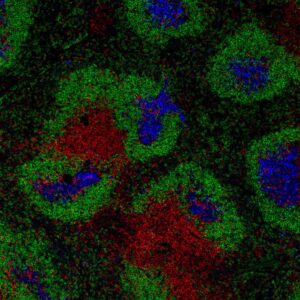
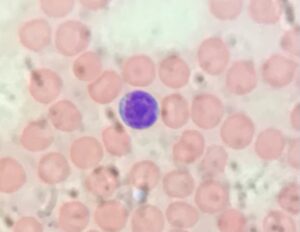
I still remember my first immunology class, when our professor started to explain the different immune cell types. He said that each cell performed a specific function which was determined by the proteins it expressed. Sounds pretty easy, right? Well, it didn’t in my mind. All I could think was: how? How does one know which proteins a cell expresses? How can you tell cell A from cell B? I knew that we could see different cell types using microscopes (which, by the way, definitely goes on my “sparks joy” list). But I wondered if that was the only way.
Turns out that I lived around 22 years of my life without knowing about an experiment called Flow Cytometry. I know, hard to believe. Trust me, Flow Cytometry is one of the most used experiments by immunologists. So, learning how it works and how to read its results is crucial. For those that are not yet familiar with this EXTREMELY powerful tool, this post is for you. Like always, get ready to be amazed!
Flow Cytometry: The basics
I believe that in order for us to understand any concept in science, we first need to be presented with a problem. So here is the problem of today’s post: Imagine that you are a cancer researcher, and you want to determine which immune cells are present inside a specific tumour. In order to do so, you are able to collect a piece of the tumour to do your analysis.
Let’s say that your first thought was to analyze these cells under the microscope. After prepping the sample, you saw a lot of cells, one next to the other. Yes, maybe you saw some different shapes, but that was pretty much it. Your initial question, however, was not to analyze cell structure but to determine and quantify the different cell types present inside the tumour.
So, you decided to change your approach and separate each cell from one another. This great idea is the first step required in order to perform Flow Cytometry. By separating one cell from another (aka. preparing a single cell suspension) you dilute all the cells in a solution. Now what? Now you need to characterize it.
As I mentioned before, each cell type expresses a combination of different proteins. Let’s say cell A expresses protein A and cell B express protein B. Now, you just need a tool, like a tag, which is very specific to protein A, and another which is specific to protein B… you see where I’m going with this, right? Exactly! Our body is able to generate such tools. These are called antibodies, and they act like tags to help our immune system “label” proteins from foreign invaders.
Scientists were extremely clever and decided to use this natural immune tool to their advantage. They generated antibodies against protein A and protein B (and against a huge number of other proteins). So, if you add a high amount of the antibody against protein A to your single-cell suspension, it will bind to cells that express protein A on their surface. Since antibodies are usually highly specific, you are now able to tag (label) all cells expressing your protein of interest.
Now, we need to make sure that each different antibody will “send a different signal”. This means that a cell label with antibody A must send a signal which is different from a cell label with antibody B. Finally, we need a machine that will be able to detect this information and report back to us in an easy way. Voila! This is the idea behind flow cytometry, which is very trivial, but exceptionally powerful.
How does it actually work?
The key lies in the “signal” sent by each antibody. Antibodies used in flow cytometry (and in many other experiments) are modified to have a fluorescent marker (called fluorochrome).

Representation of the basics of Flow Cytometry. Created with BioRender
Once you add your labelled sample to the flow cytometry machine, each cell will pass through a very small tube. A laser light source will then hit every single cell. As soon as a labelled cell is hit by the laser beam, it will emit photons (or light particles) which can be detected by sensors present inside the machine.
Once hit by the laser beam, different fluorochromes emit photons with different wavelengths, which are detected by sensors. So, if you label protein A with one fluorochrome and protein B with a different fluorochrome, the flow cytometry machine is able to differentiate cells expressing protein A from those expressing protein B. Cool, right?
One thing that you have to understand about scientists (and scientists in the making, like me) is that we are greedy. We don’t want to be able to separate our samples using 2 different antibodies… we want to use 5… 10… 15 antibodies, to be able to study in-depth our favourite cells. Another characteristic of pretty much all scientists is that we are always busy. We have so many experiments to run, data to analyze and coffee to drink that we cannot waste time. We want to be able to analyze… 10,000 cells per second… that sounds reasonable! Some flow cytometry machines are able to do just that, and that is why we love them!
Hows do the data look like?
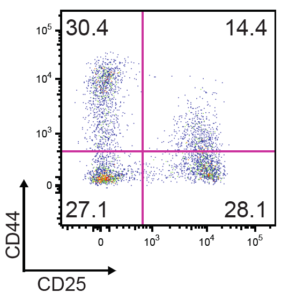
If you have already read any immunology research paper, you probably saw a graph that looks a lot like this:

A representative of Flow Cytometry results.
To read this graph is easy peasy! Each little blue dot represents a single cell that was detected as it passed through the flow cytometry machine. The difference in colour accounts for the increased number of dots at the exact same spot. In red, is where you would find the highest concentration of dots (or cells) together.
The number at the corner of the graph represents the percentage of cells present within the pink square (also called the gating). To figure out what protein a cell express, we will first think about the x-axis and the y-axis separately. Each one of them will be used to quantify a single protein.

Representation of a Flow Cytometry result. Created with BioRender.
So in our case, the x-axis quantifies protein A and the y-axis quantifies protein B. So if you have a cell present in the right bottom part of the graph, this cell expresses protein A, but doesn’t express protein B. If you have a cell on the top right part of the graph, it expresses both proteins A and B. And so on…
Note that a cell usually expresses much more than a single copy of a protein. The “amount” of protein can be measured by how far away from the origin of the graph the dot is present. Meaning that a cell located in the middle of the x-axis expresses less protein A than a cell located at the far right of the graph.
Now you must be asking, how can we test more than 2 different proteins? Well, when analyzing flow cytometry data you can actually select (or gate) your cells of interest for further study. Let’s say that you really wanted to analyze cells that are positive for proteins A and B (top right quadrant). You would then draw a gate (a circle in our case, but it can be square or any other shape) around this population.
Once the population is selected, you can change the axis to analyze other proteins. Imagine that you had also stained your sample for with antibodies against protein C and protein D. By placing protein C on the x-axis and D on the y-axis you can analyze their expression.
Representation of a Flow Cytometry gating. Created with BioRender.
If you see cells at the top right quadrant, these cells are not only positive for proteins C and D but also for A and B, since these were the cells you selected at first. And you can go on, and analyze different proteins and combinations of proteins in each cell population.
Moreover, with just a slight modification of the antibody staining procedure, you can also stain proteins present inside the cells, and even inside the nucleus of the cells, making this experiment even more powerful!
Can I collect my favourite cells in a tube?
But wait, it doesn’t stop here. What if you tell me: “Stefanie, I would really like to collect cells expressing A, B and C for further analysis”. Ambitious, I like it! If you truly love these cells and want to separate them from all the other cells (maybe to cultivate them, to extract protein, to extract DNA etc), you CAN! With an experiment called Cell Sorting.
During flow cytometry, after your cells pass through the tube and are hit by the laser beam, they go to waste. In this experiment, you only want the data (the graphs explained above), so as soon as you have the data, your cells go “bye, bye”. But during cell sorting, you can select the cells you want to collect, by gating around the population of interest (just like we did before) and telling the machine to sort. Therefore, only your favourite cells (the ones you gated) are physically collected in a tube. Mind-blowing, I know!
Taking all these amazing features together, you now know why flow cytometry and cell sorting experiments were essential to allow our science to advance at an extremely high speed. So, next time someone gives you a tube labelled “my favourite cells” you know how they did it!
Stay safe and I will see you next Tuesday!
From your immunologist – in training,
Stefanie Valbon


